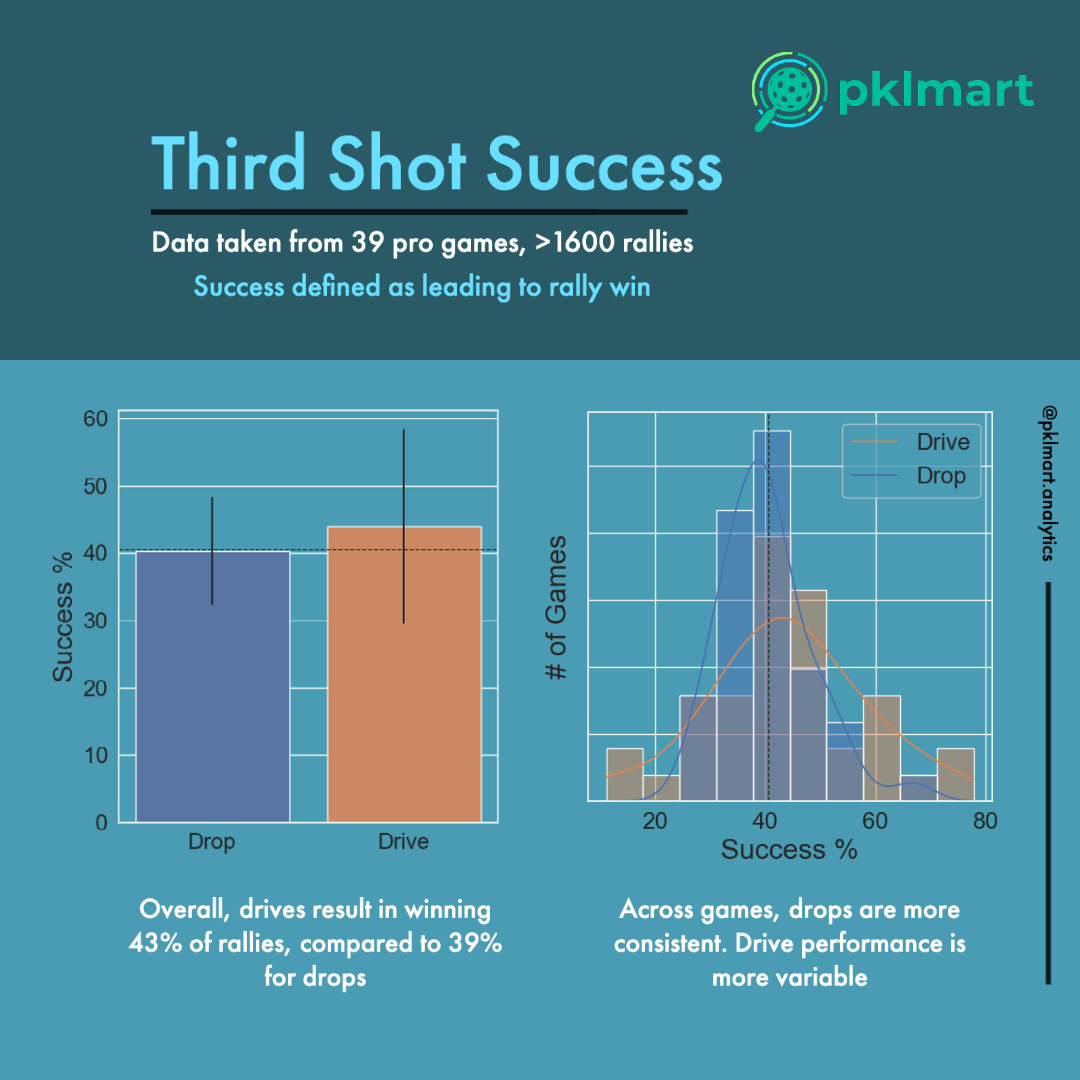
As an avid pickleball player, I’m always trying to improve my game and increase my chanses of winning a match. Many questions naturally arise from this pursuit, such as:
- Is there an advantage to serving first?
- What type of third shot should I hit (drop, drive, or lob)?
- Is it better to play safe or try to hit more winners and risk making more errors?
I expected a quick google search would shed some light on these topics, but I was surprised to find that there is very little data available on pickleball statistics. Recently, however, I came across pklmart, which is a database containing a large amount of highly detailed pickleball data from professional tournaments and amateur matches. This data includes information on every shot, rally, game, match, and tournament. Inspired by the database and, I decided to write a python package to analyze this data and answer some of my burning questions and create fun visualizations like the one above. Enter: pklshop
pklshop is a library for accessing and analyzing pickleball data from pklmart. You can find the documentation here, but I'll give a brief tour of some of the features below.
I wanted the package to be easy to use and the data to be easily accessible. To access the latest pickleball data from the pklmart database, you can simply install the pklshop package and import the data module:
Install using:
pip install pklshop
Then import the data module:
from pklshop.data import *
(Note that since this package is writen using
nbdev it is safe to wildcard import because
the __all__ variable is automatically generated for each module.)
There are built-in classes to help you analyze the data. For
example, you can use the
Player
class to get a player’s stats or attributes:
p = Player("P1")
p2 = Player("P2")
head_to_head(p,p2)
Jesse Irvine has played against Catherine Parenteau in 1 matches and has won 1 times
And likewise for Games, Teams, Matches, and Rallys. e.g.:
g = Game("G1")
g.summarize_game()
Anna Leigh Waters & Leigh Waters beat Jesse Irvine & Catherine Parenteau 12-10 in game G1
             Player  Error %  Winner %
       Jesse Irvine    17.46      9.52
Catherine Parenteau     1.59      0.00
  Anna Leigh Waters     1.59      3.17
       Leigh Waters     9.52      4.76
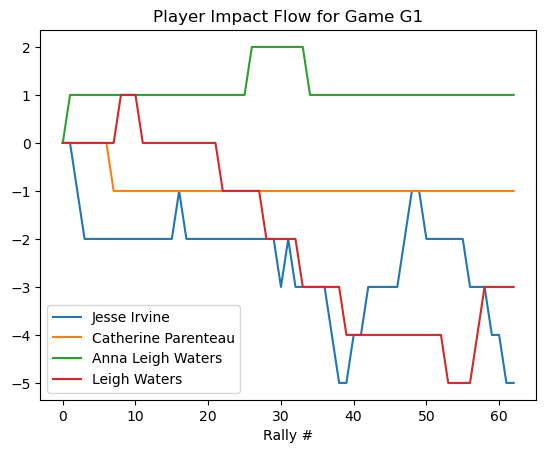
You can gain aditional insights from data vizualizations, such as the player impact score, defined as # winners + # errors foced - # unforced errors
g.plot_impact_flow()

To see more analysis in action, check out the examples in the repository. For more details, look at the source notebooks in the nbs directory of the repository.